Charting
Charting at Stanford Hospital
Charting is still a manual process at Stanford. Here are some sample/suggested wording and phrases for the anesthetic record.
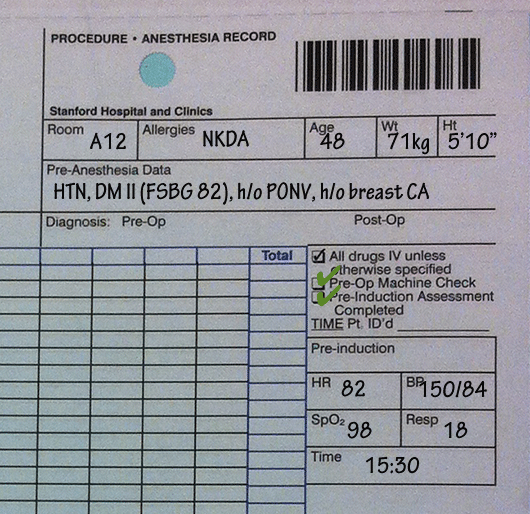
Here's what a blank chart looks like:
![]()
Start by Filling Out Identifying Information
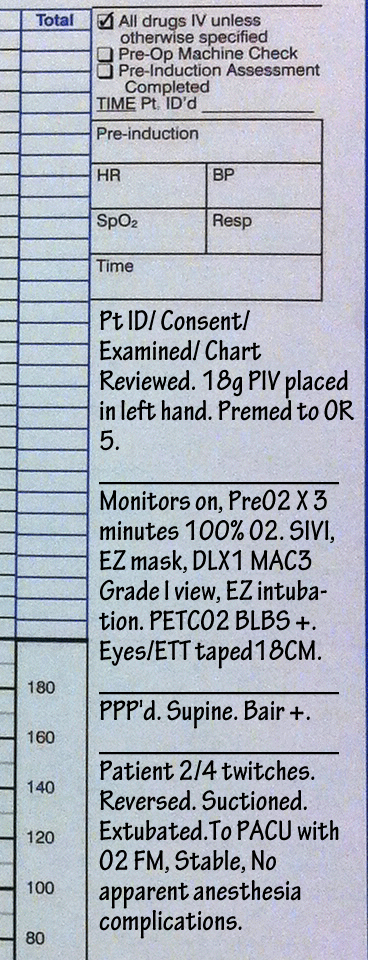
Now let's Chart For a Standard GETA
Pt ID/Consent/Examined/Chart Reviewed. 18g PIV placed in left hand. Premed to OR 5.
Translation: The patient was identified, consented, examined and the chart was reviewed. An 18 gauge peripheral intravenous catheter was placed in the left hand. Midazolam premedication was administered en route to operating room 5.
______________________________
Monitors on, PreO2 X 3 minutes 100% O2. SIVI, EZ mask, DLX1 MAC3 Grade I view, EZ intubation. PETCO2 BLBS +. Eyes/ETT taped18CM.
Translation: ASA Standard monitors were placed on the patient, 100% oxygen by face mask was delivered for 3 minutes for preoxygenation. Smooth intravenous induction of general anesthesia was followed by easy mask ventilation. Direct laryngoscopy was attempted once with a MAC 3 blade yielding a Cormack-Lehane grade I view of the glottic opening. Endotracheal intubation was easily achieved and proper placement was confirmed by postive end-tidal CO2 capnography and bilateral breath sounds. Eyes and endotracheal tube was taped at 18 CM.
______________________________
PPP'd. Supine. Bair +.
Translation: Padding, pressure points and positioning of the patient were checked. Forced air warming blanket placed on patient.
______________________________
Patient 2/4 twitches. Reversed. Suctioned. Extubated.
To PACU with O2 FM, Stable, No apparent anesthesia complications.
Here's what it looks like in the chart:
Next, chart the Anesthetic Timeline
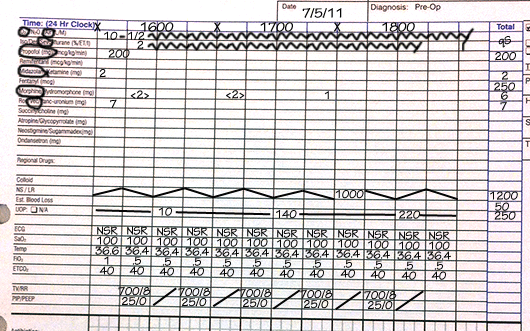
Begin charting the timeline by establishing the time at the top of the page. X=30 minutes.
When charting drugs, make sure to circle the correct drug on the timeline. Make sure to write units clearly (e.g. mcg vs. mg).
Urine output can be charted cumulatively every hour.
Drug dosages in between <> indicate a total dose given over a period of time defined by the brackets.
Chart the Vitals
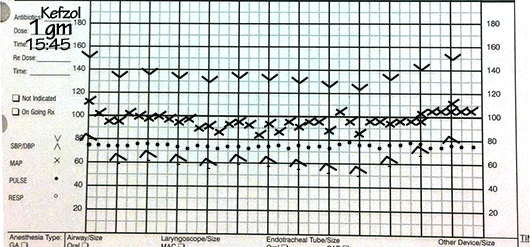
Mean arterial blood pressure (X) and heart rate (•) should be charted every five minutes. Systolic and diastolic pressures should be charted every 15 minutes.
The time and dose of antibiotics should also be charted. If surgeons request no antibiotics, make sure to chart "Not Indicated".
Finally, Complete the Bottom of the Chart

The bottom of the chart should be carefully completed, including documenting the ASA physical status, procedure, times, and surgical staff.
Please remember, if you didn't chart it, you didn't do it!